Build Guide #9 Debugging Gradle Scripts
"Build Guide" is a series of articles exploring Android build-related topics, covering Gradle, Android Gradle Plugin, Kotlin Script, and other tools, as well as their architectural applications. Starting from problem discovery and resolution, and landing on sharing new knowledge to improve productivity.
This article discusses the current debugging support for *.gradle.kts scripts in IDEA / Android Studio.
Debugging Capabilities
Regarding the definition of debugging capabilities, let me give an example. We add various script snippets to a common build.gradle.kts, including but not limited to property declarations, file reading, Gradle API operations, AGP API operations, etc., then set multiple breakpoints. When compiling, we remote attach to check whether it can suspend at the correct location, whether it can get context information, and whether it can perform Expression Evaluate operations.
Specific test points:
- Context information inside the
android { default { ... } }closure; - Context information inside the
dependencies { ... }closure; - A small custom script snippet in
build.gradle.kts, containing property definitions, Gradle API calls, AGP API calls - context information at these three points; - A small custom script snippet in
prebuilt.gradle.ktsinside/buildSrc, also containing the same three points; - A custom plugin inside
/buildSrc- context information when running the plugin's apply method (as a reference for complete debugging capability).
I conducted two experiments. The first was about half a year ago using Android Studio 4.0 + IDEA 2020.1, and the second was recently using Android Studio 4.2.0-beta04 + IDEA 2021.1.EAP. The test results below all use the second IDE version plus:
- Android Gradle Plugin 4.1.1
- Kotlin 1.4.30
- Gradle 6.8.2
Here we focus on Kotlin DSL; the Groovy DSL situation can be analyzed similarly.
Multi-module Android Project
For the first test, we used a multi-module (and multi-Application) project, with the following results:
| # | Test Item | IDEA & Android Studio |
|---|---|---|
| 1 | android { default { ... } } |
Y |
| 2 | dependencies { ... } |
Y |
| 3 | build.gradle.kts |
|
| 3.1 | N | |
| 3.2 | Y | |
| 3.3 | Y | |
| 4 | prebuilt.gradle.kts |
|
| 4.1 | N | |
| 4.2 | Y | |
| 4.3 | Y | |
| 5 | plugin | Y |
Quick summary:
- The results from both IDEs are completely consistent (not surprising even though AS is the community edition);
- Breakpoints at 3.1 and 4.1 can be correctly recognized but cannot get context information;
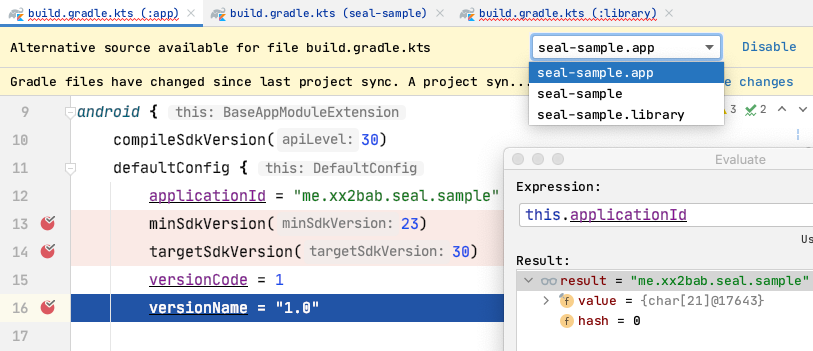
- When debugging breakpoints in
build.gradle.kts, you must manually specify which script the current source corresponds to, as shown in the dropdown menu in the image above; the basis for judgment is the context information provided by thethisobject in the Variables section of the current debug panel. For example, herethispoints to DefaultConfig, and we only set breakpoints on the defaultConfig of the app module across multiple scripts, so we selectapp; - In this test, Gradle script debugging support is still not comprehensive enough.
Single-module Kotlin Project
Next, let's test a simple Kotlin project:
| # | Test Item | IDEA & Android Studio |
|---|---|---|
| 1 | java { ... } |
Y |
| 2 | dependencies { ... } |
Y |
| 3 | build.gradle.kts |
|
| 3.1 | N | |
| 3.2 | Y | |
| 3.3 | N/A | |
| 4 | prebuilt.gradle.kts |
|
| 4.1 | N | |
| 4.2 | Y | |
| 4.3 | N/A | |
| 5 | plugin | Y |
The results are no different from the previous multi-module Android project.
Common Debugging Issues
Here are some common issues for reference:
Breakpoint Line Jumping
When dealing with some simple requirements, such as modifying generated APK names, we often write and debug scripts directly in build.gradle.kts. During debugging, although breakpoints appear to be set in AS or IDEA, various situations occur during execution where the source code cannot be matched, causing line jumping. In this case, you need to manually specify the corresponding script using the method mentioned in the summary above.
IDEA Support for Android Plugin
Note that IDEA generally supports new features faster, but support for Android Gradle Plugin lags behind Android Studio. For example, after the current 4.1.1 version of Android Studio was released, IDEA announced support for 4.1 in 2020.3.2 (but actual testing shows it doesn't support 4.1.1; the issue says 2021.1.EAP actually supports it).
Using Plugin Wrapping
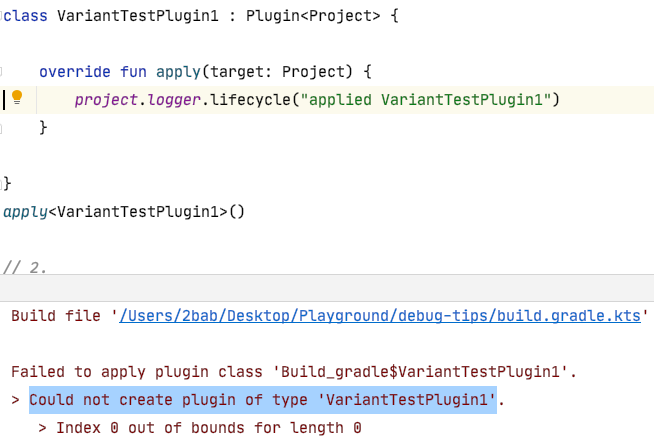
In the early days based on Groovy DSL + build.gradle scripts (around AGP 2.x era), debugging support was even worse. But there was a workaround for the third test point above: wrap the custom script block in build.gradle into a Plugin. However, this is currently not viable in AS 4.2.0-beta04 or IDEA 2021.1.EAP testing. On the Kotlin DSL side, although the API documentation looks supportive, the plugin cannot actually be created, causing script compilation failure, making debugging moot. Here's a reference issue.
Run Button Displayed in build.gradle(.kts) in IDE
Additionally, some colleagues may have seen a "run button" and "menu" like this in build.gradle + IDEA 2020.x environment, similar to running a unit test or a Java main method:
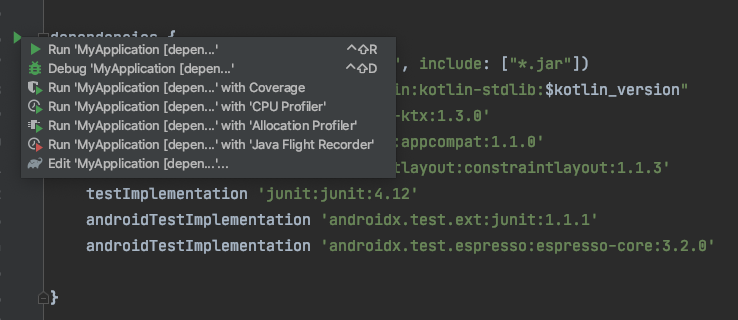
However, its principle should be consistent with manually executing Gradle Sync / Build, and it hasn't changed our test results.
Summary
Gradle script (specifically *.gradle.kts, though *.gradle should be similar) debugging support is currently weak. Complex logic should use precompiled plugins/standalone plugins in buildSrc, which have complete debugging capabilities.